| Compiled by: Karel van der Waarde 2024 | |
| | |
| |
| | |
| Colofon & notes | |
|
|
Participation and evaluation
The literature mentions many different methods and criteria to assess the performance of labels and pictograms. It is not possible to evaluate the quality of a design outside its interpretation by people in a specific context.
There are several standards and guidelines for ‘human factors’. Examples are: ‘Guidance on the Application of Human Factors to Consumer Products (2020)’.
Purmehdi M, Legoux R, Carrillat F, Senecal S. (2017) ‘The Effectiveness of Warning Labels for Consumers: A Meta-Analytic Investigation into Their Underlying Process and Contingencies’. Journal of Public Policy & Marketing. 36(1), 36–53. [DOI].
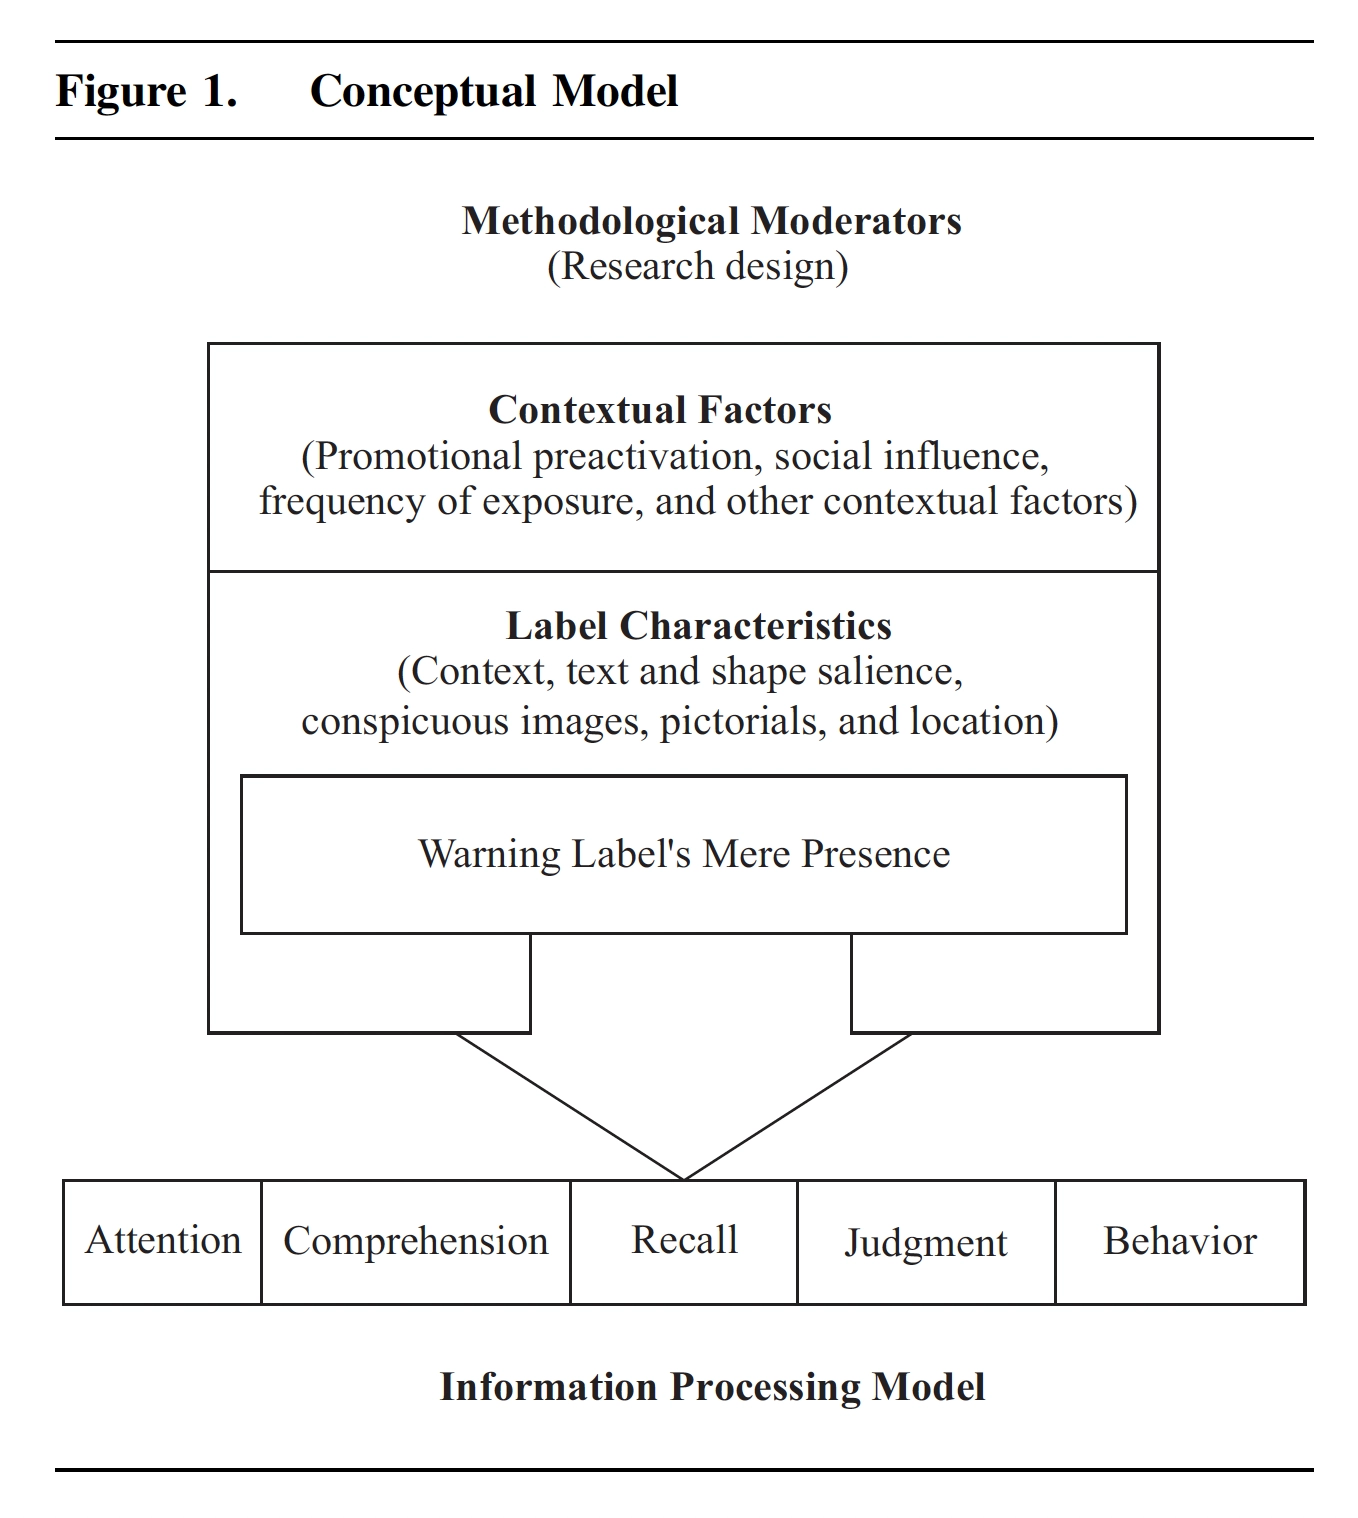
Aim of visuals: A warning labels ‘is that of conspicuous information vehicles that
are attached to a product, designed as part of the packaging, or included in instruction manuals or promotional material that address the hazards associated with use of the product.’
People: [The included studies involved 22.243 participants].
Method: Literature review - meta analysis.
Effect of visuals: The authors found 243 different effects in 66 articles about warnings.
Suggestions for design:
Suggestions for policy: There is evidence of increased effectiveness when preactivating the label by means of an integrated communication strategy. The authors suggest: ‘that researchers and policymakers alike should expand their span of focus from the physical design of the label to include contextual moderators.
Comment: Table 1 on pages 40-41 provides a useful list of criteria and example studies to evaluate warning labels. The information processing model in figure 1 seems relevant too. The name ‘meta-analysis’ is warranted:
Beusekom MM van, Land-Zandstra AM, Bos MJW, Broek JM van den, Guchelaar H-J. (2017) ‘Pharmaceutical pictograms for low-literate patients: Understanding, risk of false confidence, and evidence-based design strategies’. Patient Education and Counseling. 100, 966–973. [DOI].
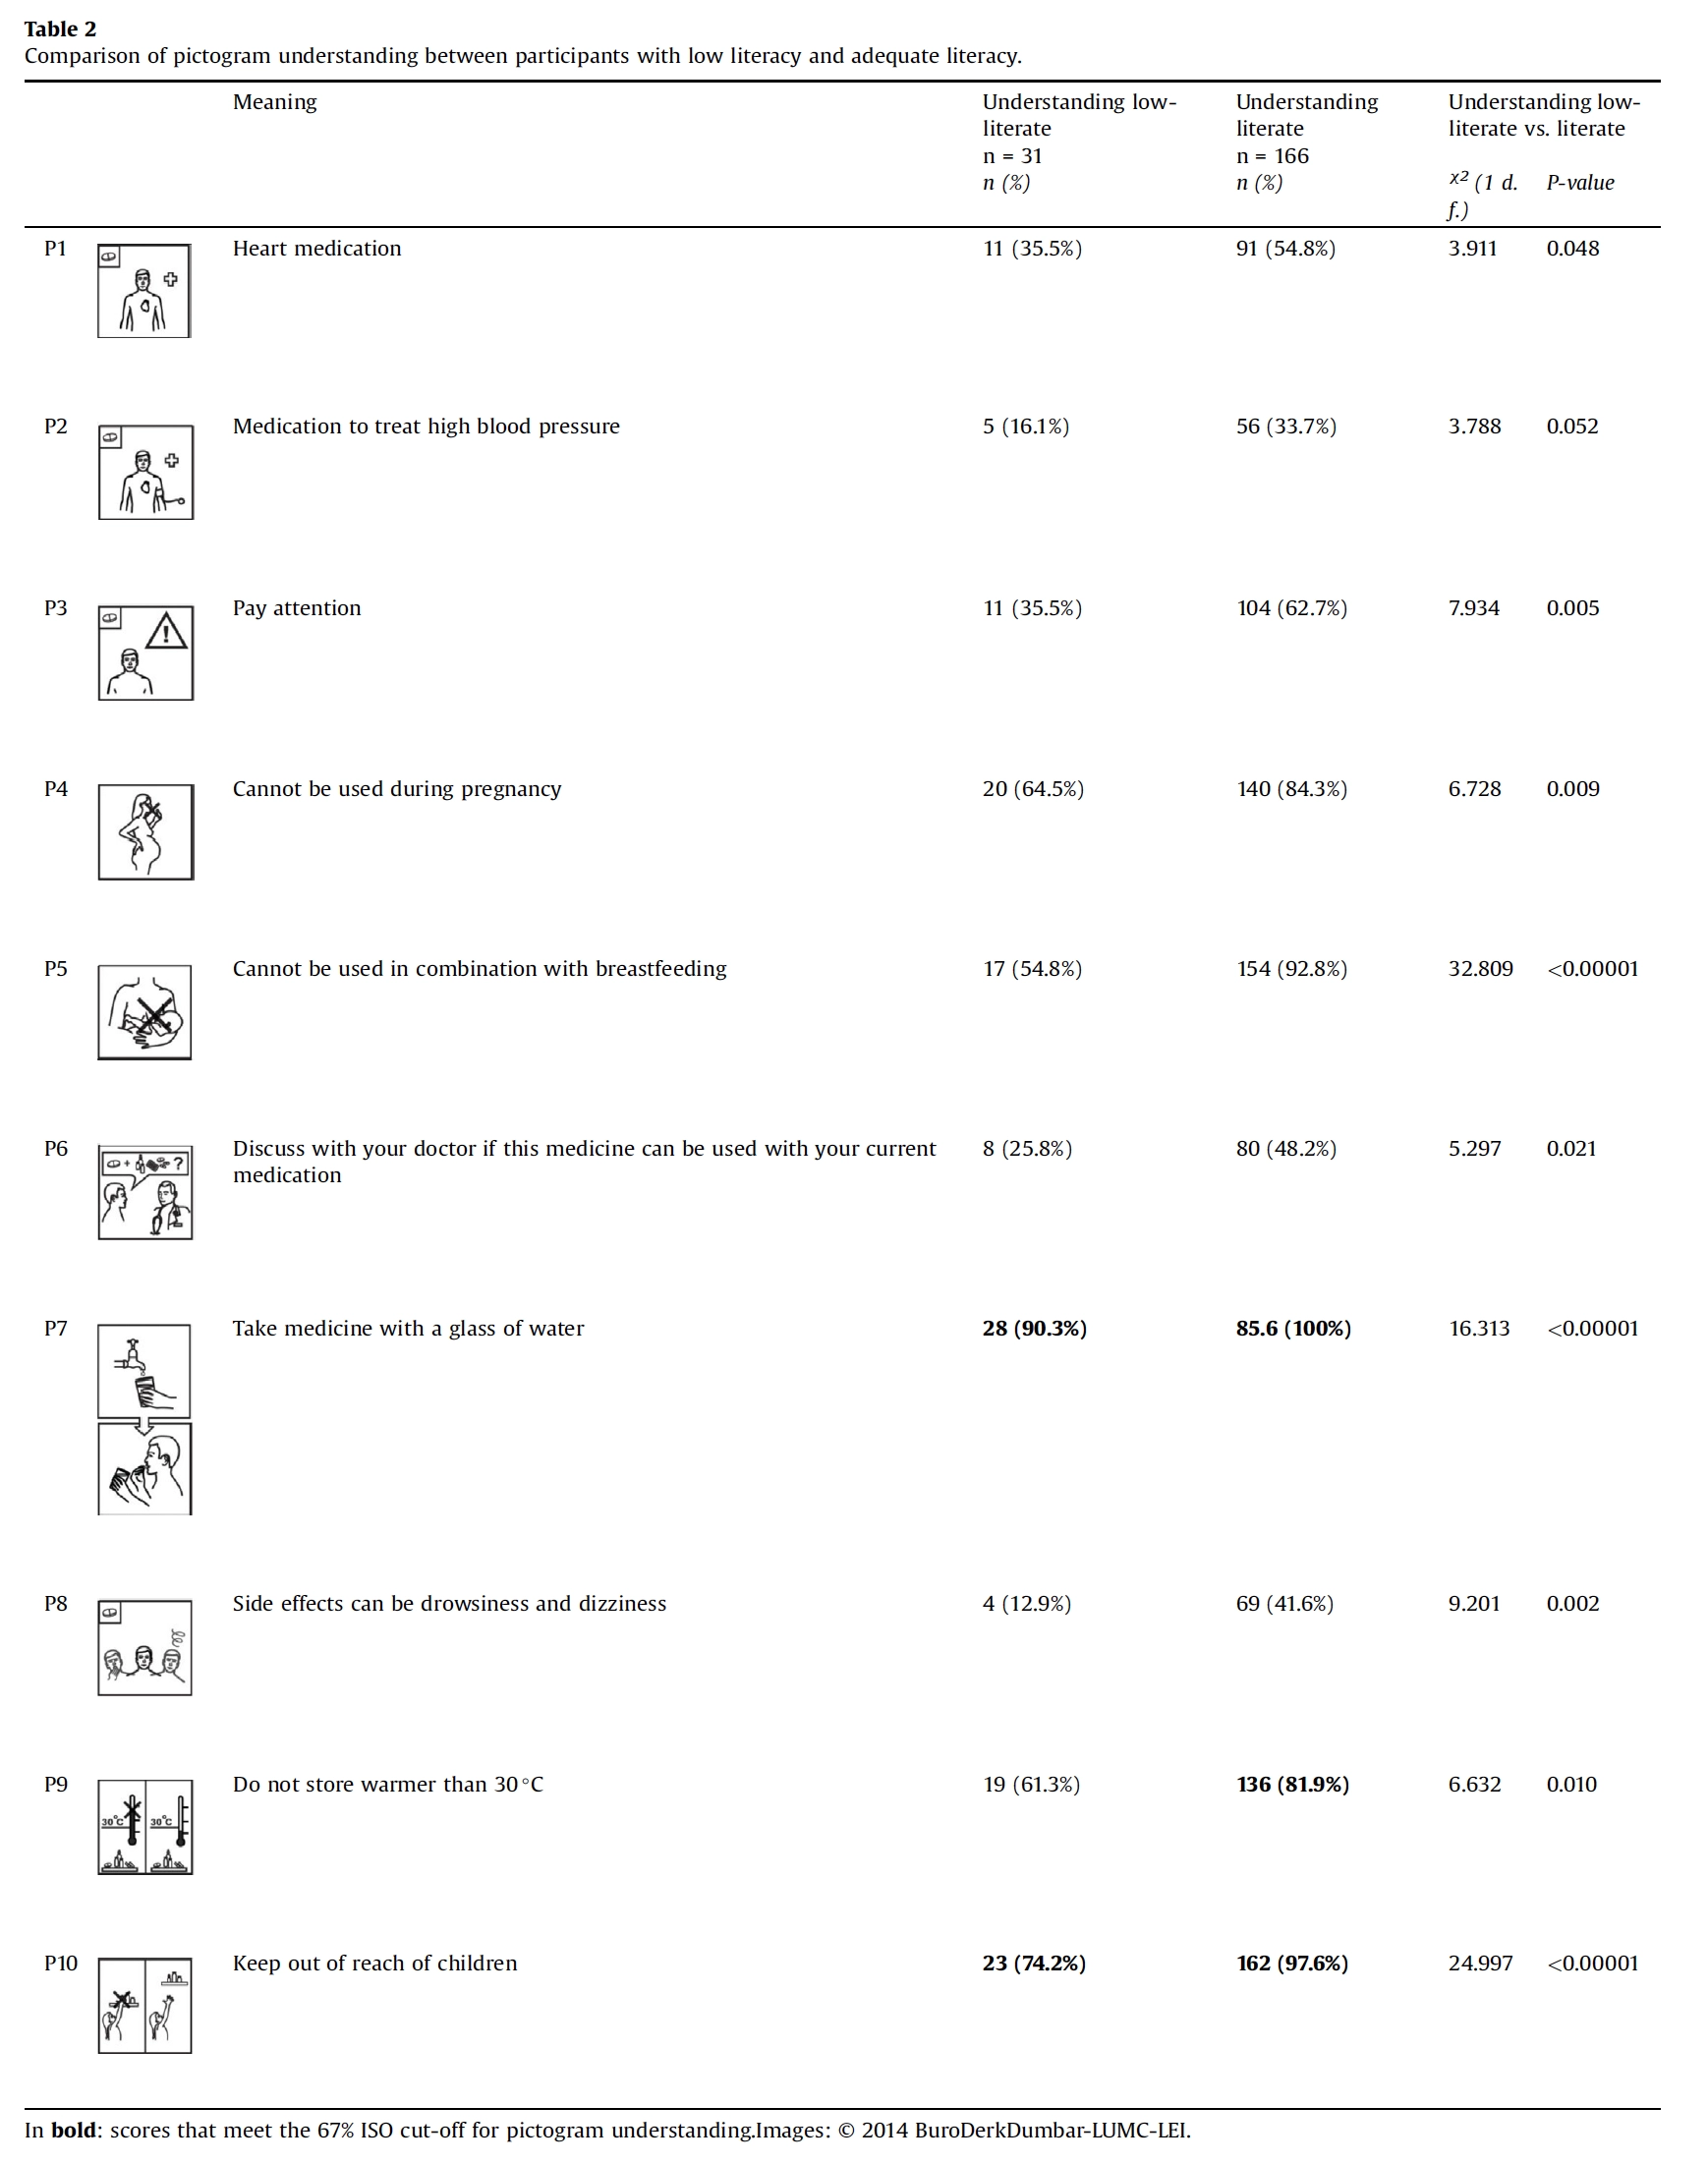
Aim of visuals: To inform patients about medicines.
People: Netherlands: 197 pharmacy visitors, 55 individual interviews
Method: Literacy assessment using Dutch version of the Rapid Estimate of Adult Literacy in Medicine, show 10 pictograms separately: explain meaning of pictogram + how confident are you + certainty rating.
Effect of visuals: Pictograms scored between 31.0% and 98.5% on understandability.
Suggestions for design: The participants suggested several design improvements.
Suggestions for policy: -
Comment: This study shows that low-literate people have more difficulty understanding pictograms than people with adequate literacy. The visual quality of pictograms in this study needs to be questioned. A performance level of 67% might not be suitable for medicines.
Tyers A. (2008) ‘Performance based design’. Information Design Journal. 16(3): 202–215. [DOI]. [This paper focuses on the role of testing in studio practice. The methods can be applied consistently across a range of information design problems and that the resultant designs could consistently perform at an acceptable level. ‘Testing provides concrete evidence that a design change is required, clues as to what the design changes should be and evidence that those changes are the appropriate ones to make.’]
Foster J, Koyama K, Adams A. (2010) ‘Paper and on-line testing of graphical access symbols in three countries using the ISO 9186 comprehension test’. Information Design Journal. 18(2), 107–117. [DOI]. [Experiments in Japan, Australia, United Kingdom of the same symbols according to. ISO 9186-1:2007. Results from the three countries demonstrate a high level of agreement and also that the two methods of administration had no detectable influence on results. The use of testing as an aid to
symbol redesign is discussed.]
Waide P, Eide A, Watson R, Krivosik J, Attali S, Schiellerup P. (2013) ‘The new energy label: assessing consumer comprehension and effectiveness as a market transformation too’. ECEEE Summer Study Proceedings. 1683-1694. [Website]. [page 1693: ‘Finally, it is strongly recommended that all future proposed design modifications for the energy label be tested for efficacy with consumers prior to any decision being made on their deployment.’]
Dewar R, Pronin M. (2023) ‘Designing road sign symbols’. Transportation Research Part F: Psychology and Behaviour. 94, 466–491. [DOI]. [Page 489: ‘The value of conducting thorough research, performing comprehension and legibility testing when possible, and exercising good judgment when approaching design projects cannot be underestimated.’]
Stahl-Timmins W. (2017) ‘Methods for evaluating information design’. pp. 451-462 in: Black A, Luna P, Lund O, Walker S. (Eds) Information design. Research and practice. [Webite]. [This article provides an overview of evaluation possibilities.]