| Compiled by: Karel van der Waarde 2024 | |
| | |
| |
| | |
| Colofon & notes | |
|
|
Climate impact food labels
The name ‘Climate impact’ refers to several different measurements such as CO2-equivalents, greenhouse gas emissions, climate friendliness, environmental impact, sustainable food choices, and carbon footprint.
Carrero I, Valor C, Diaz E, Labajo V. (2021) ‘Designed to Be Noticed: A Reconceptualization of Carbon Food Labels as Warning Labels’. Sustainability. 13, 1581. [DOI].
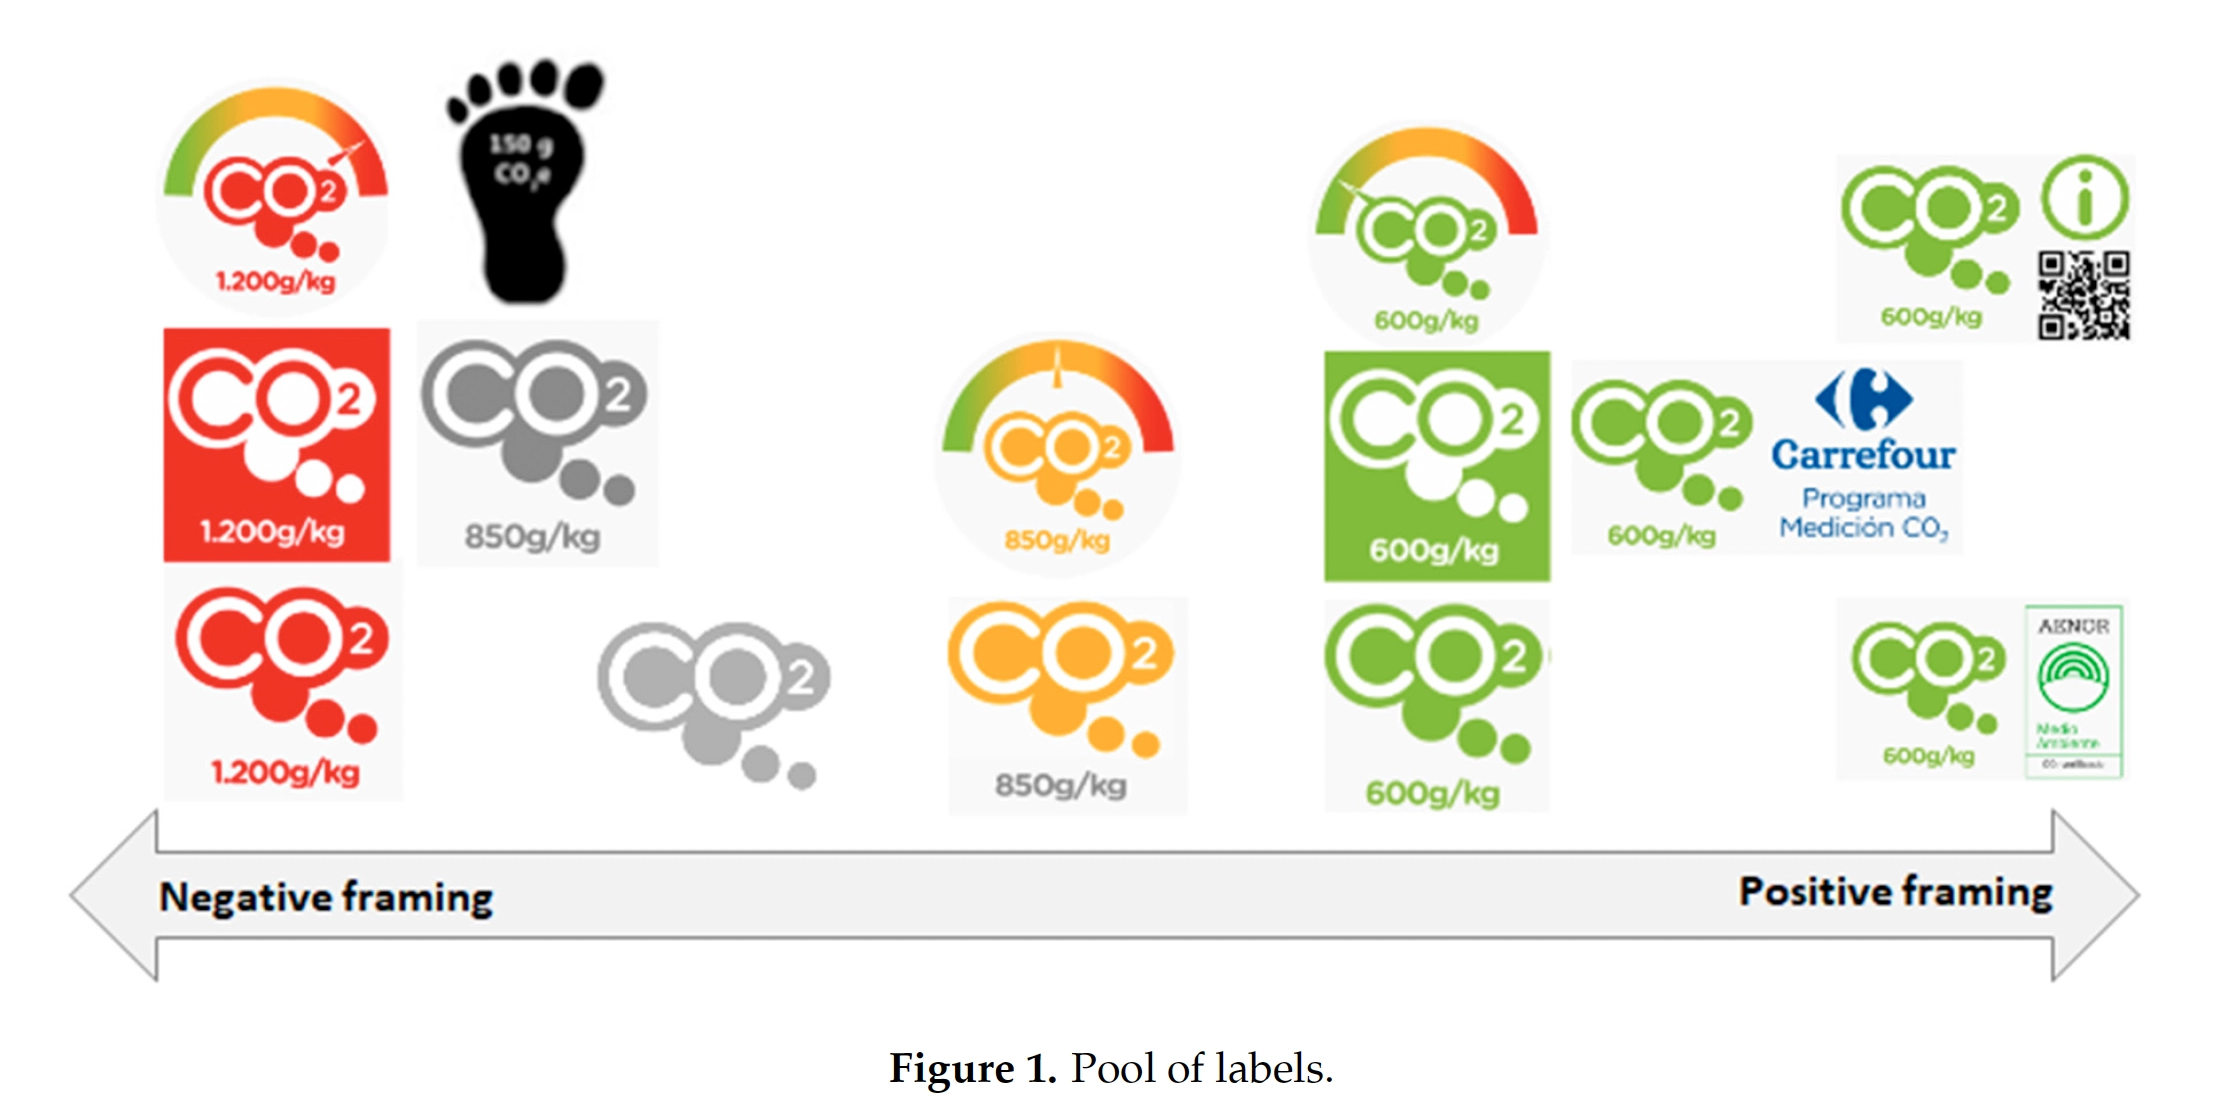
Aim of visuals: ‘Carbon labels are considered a fundamental tool for reducing emissions associated with grocery products.’ + ‘The labels were purposefully designed for this study,’
People: 54 people, Madrid, Spain.
Method: Six focus groups; Six features (location, size, color, icons, a colored background or border, and textual anchors).
Effect of visuals: ‘The study participants understood the label as conveying information regarding pollution in the product rather than the emissions of the product.’
Suggestions for design: ’A clear and simple design prevents information overload and, according to the participants, is more easily noticed and understood.’
Suggestions for policy: “We propose to reconceptualize carbon labels as warning labels, as previously suggested in other studies.’
Comment: The labels that are used in this study are not designed as ‘warnings’. The authors conclude: ‘the cues proposed to be included in label design may indeed attract the attention of consumers, but they will not be sufficient to educate consumers into the emissions generated by food and/or ensure behavior change.’
Meyerding SGH, Schaffmann A-L, Lehberger, M. (2019) ‘Consumer Preferences for Different Designs of Carbon Footprint Labelling on Tomatoes in Germany—Does Design Matter?’. Sustainability. 11(6), 1587. [DOI].
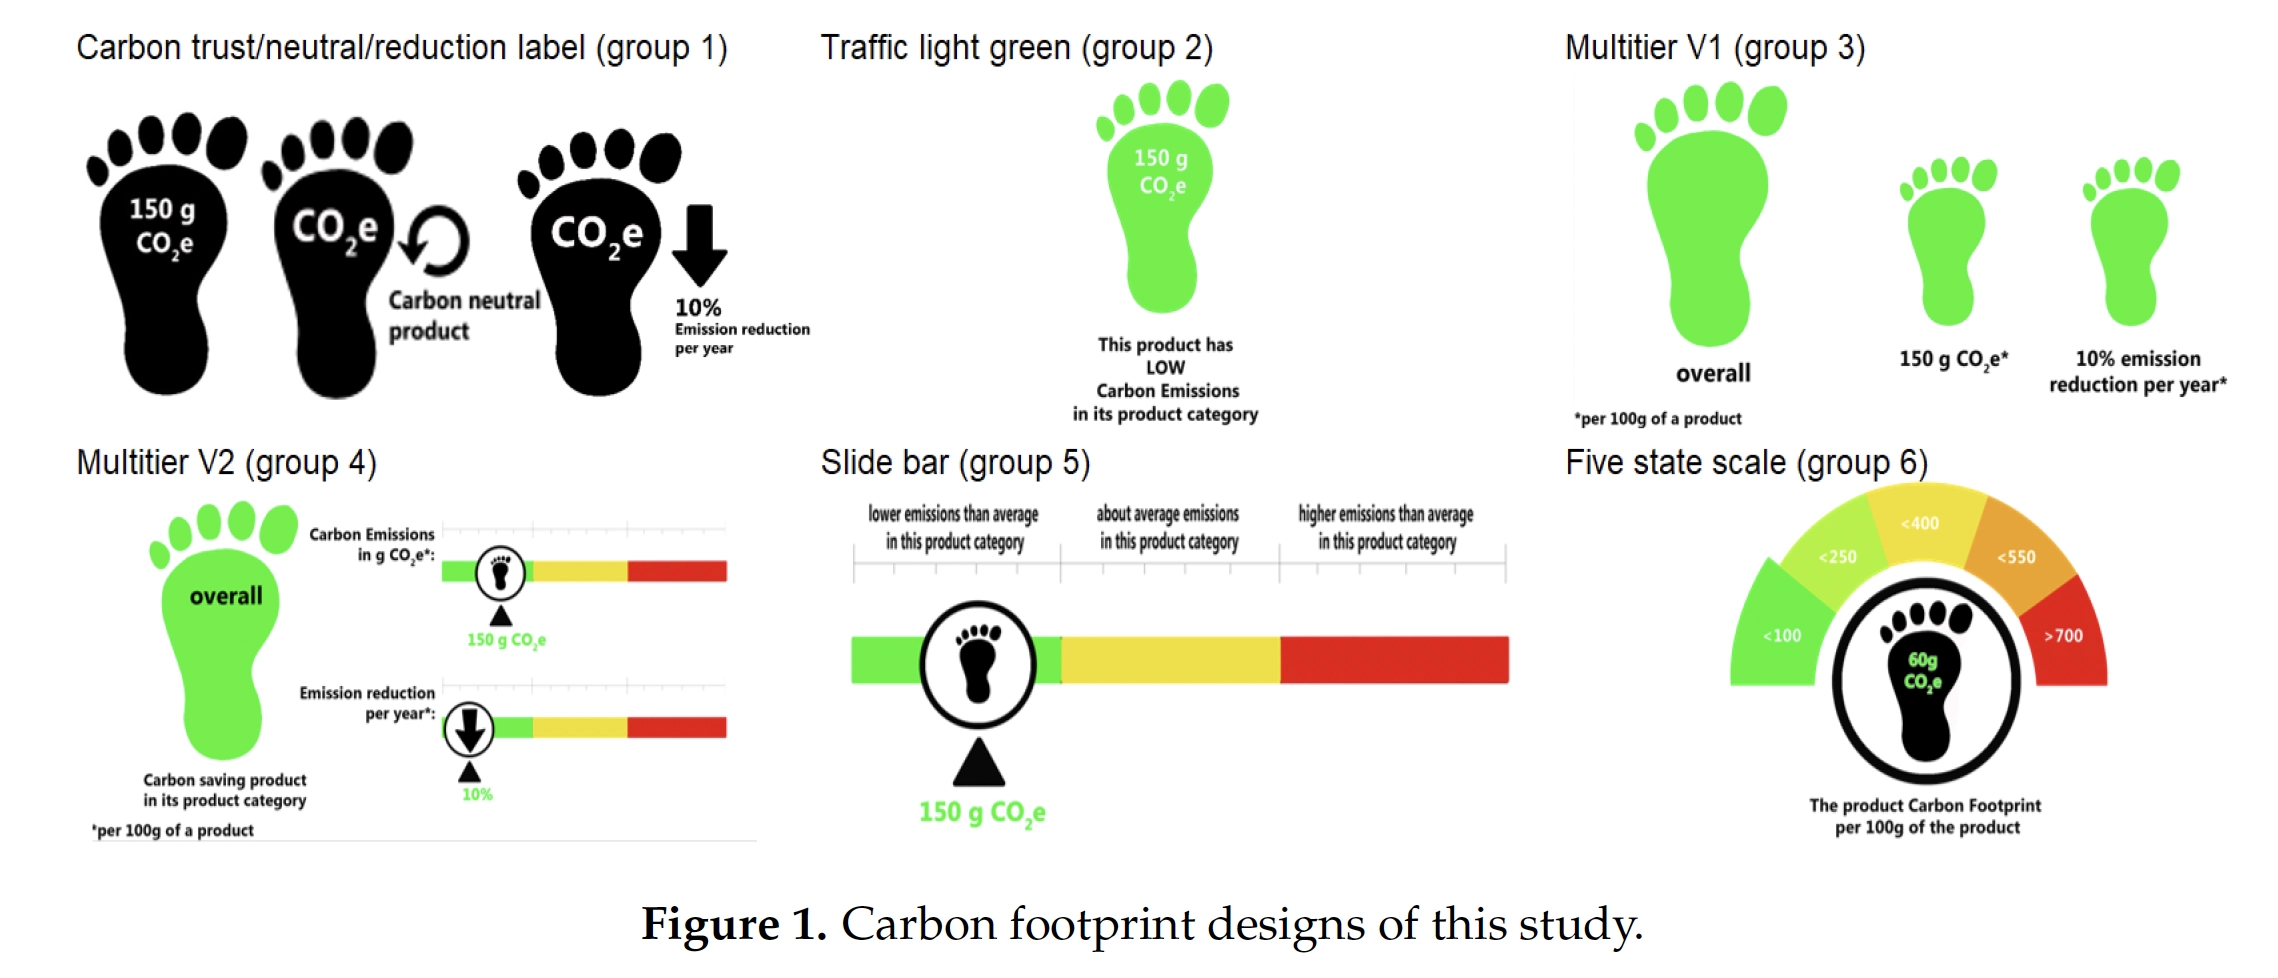
Aim of visuals: To communicate the climate impact of products to the consumer.
People: Germany, 598 consumers, (fresh tomatoes).
Method: Six different carbon footprint labels. Representative online choice-experiment and questionnaire.
Effect of visuals: ‘Qualitative carbon footprint labels using color-coded traffic light labelling are superior to those that claim climate impact reduction or neutrality, including those that provide more details regarding the climate impact of the product and the company.’
Suggestions for design: The original label design—the black footprint indicating the GHG emissions as a continuous variable—is not an effective marketing tool.
Suggestions for policy: None.
Comment: The ‘effectiveness of design’ is assessed by asking preferences in an online study. The relation with actual behaviour remains unclear.
Teufer B, Waiguny MKJ, Grabner-Kräuter S. (2023) ‘Consumer perceptions of sustainability labels for alternative food networks’. Baltic Journal of Management. 18(4), 493-508. [DOI].
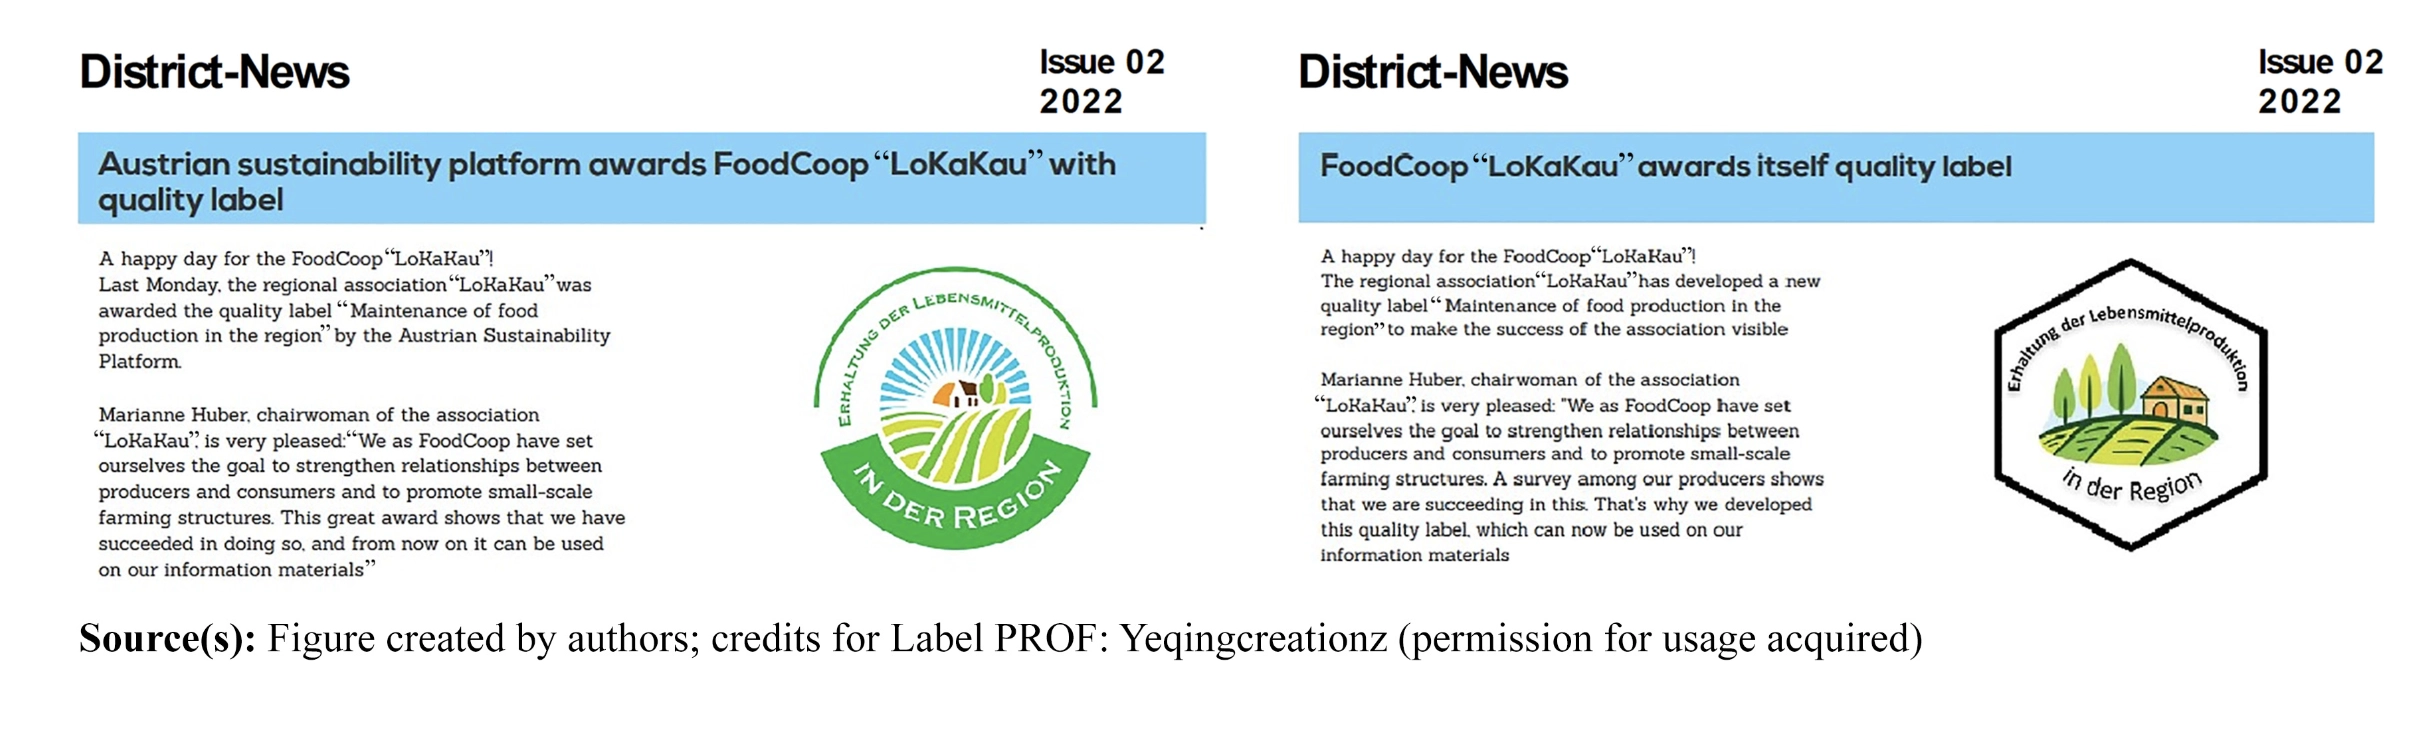
Aim of visuals: Show ‘alernative food networks’: short food supply chains, close
producer–consumer relationships and sustainable production practices. There is an increased need for information regarding the social and ecological impacts of food products
People:
Method:
Effect of visuals:
Suggestions for design: Self-organized, non-profit alternative food networks are well advised to have labels professionally designed.
Suggestions for policy:
Comment:
Wolfson JA, Musicus AA, Leung CW, Gearhardt AN, Falbe J. (2022) ‘Effect of Climate Change Impact Menu Labels on Fast Food Ordering Choices Among US Adults. A Randomized Clinical Trial’. JAMA Network Open. 5(12):e2248320. [DOI].
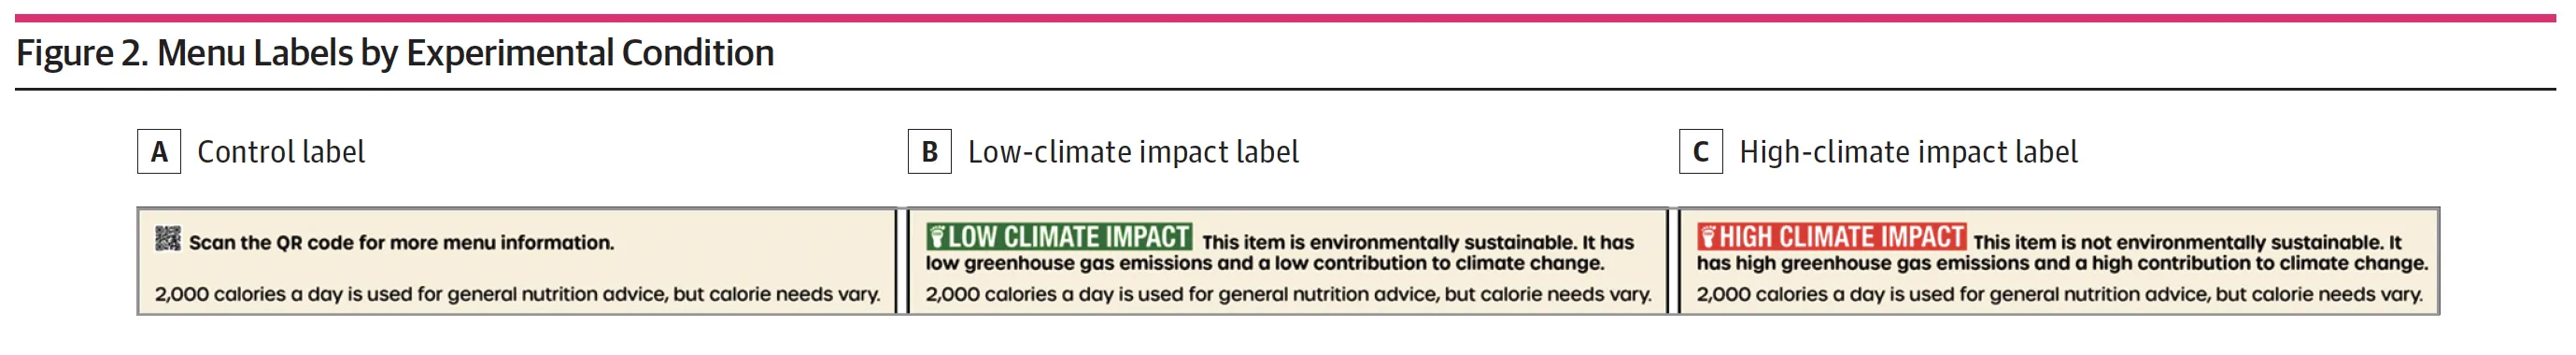
Aim of visuals: The effects of climate impact menu labels on food choices.
People: 5049 participants, USA, online
Method: Randomised Clinical trial
Effect of visuals: Climate impact menu labels, especially negatively framed labels highlighting high–climate impact items (ie, red meat), were an effective strategy to reduce red meat selections and encourage more sustainable choices.
Suggestions for design: Future research should investigate different label designs.
Suggestions for policy:
Comment: Online study + social desirability bias. The integration of the labels in the menu is missing. It is not clear what the participants got to look at. The symbols are too small, capitalized text. Colour is probably most salient.
Stephansen C, Lane H. (2023) ‘The power of climate labels the search for an optimal label design’. Journal of Philanthropy and Marketing. 29, e1818. [DOI].
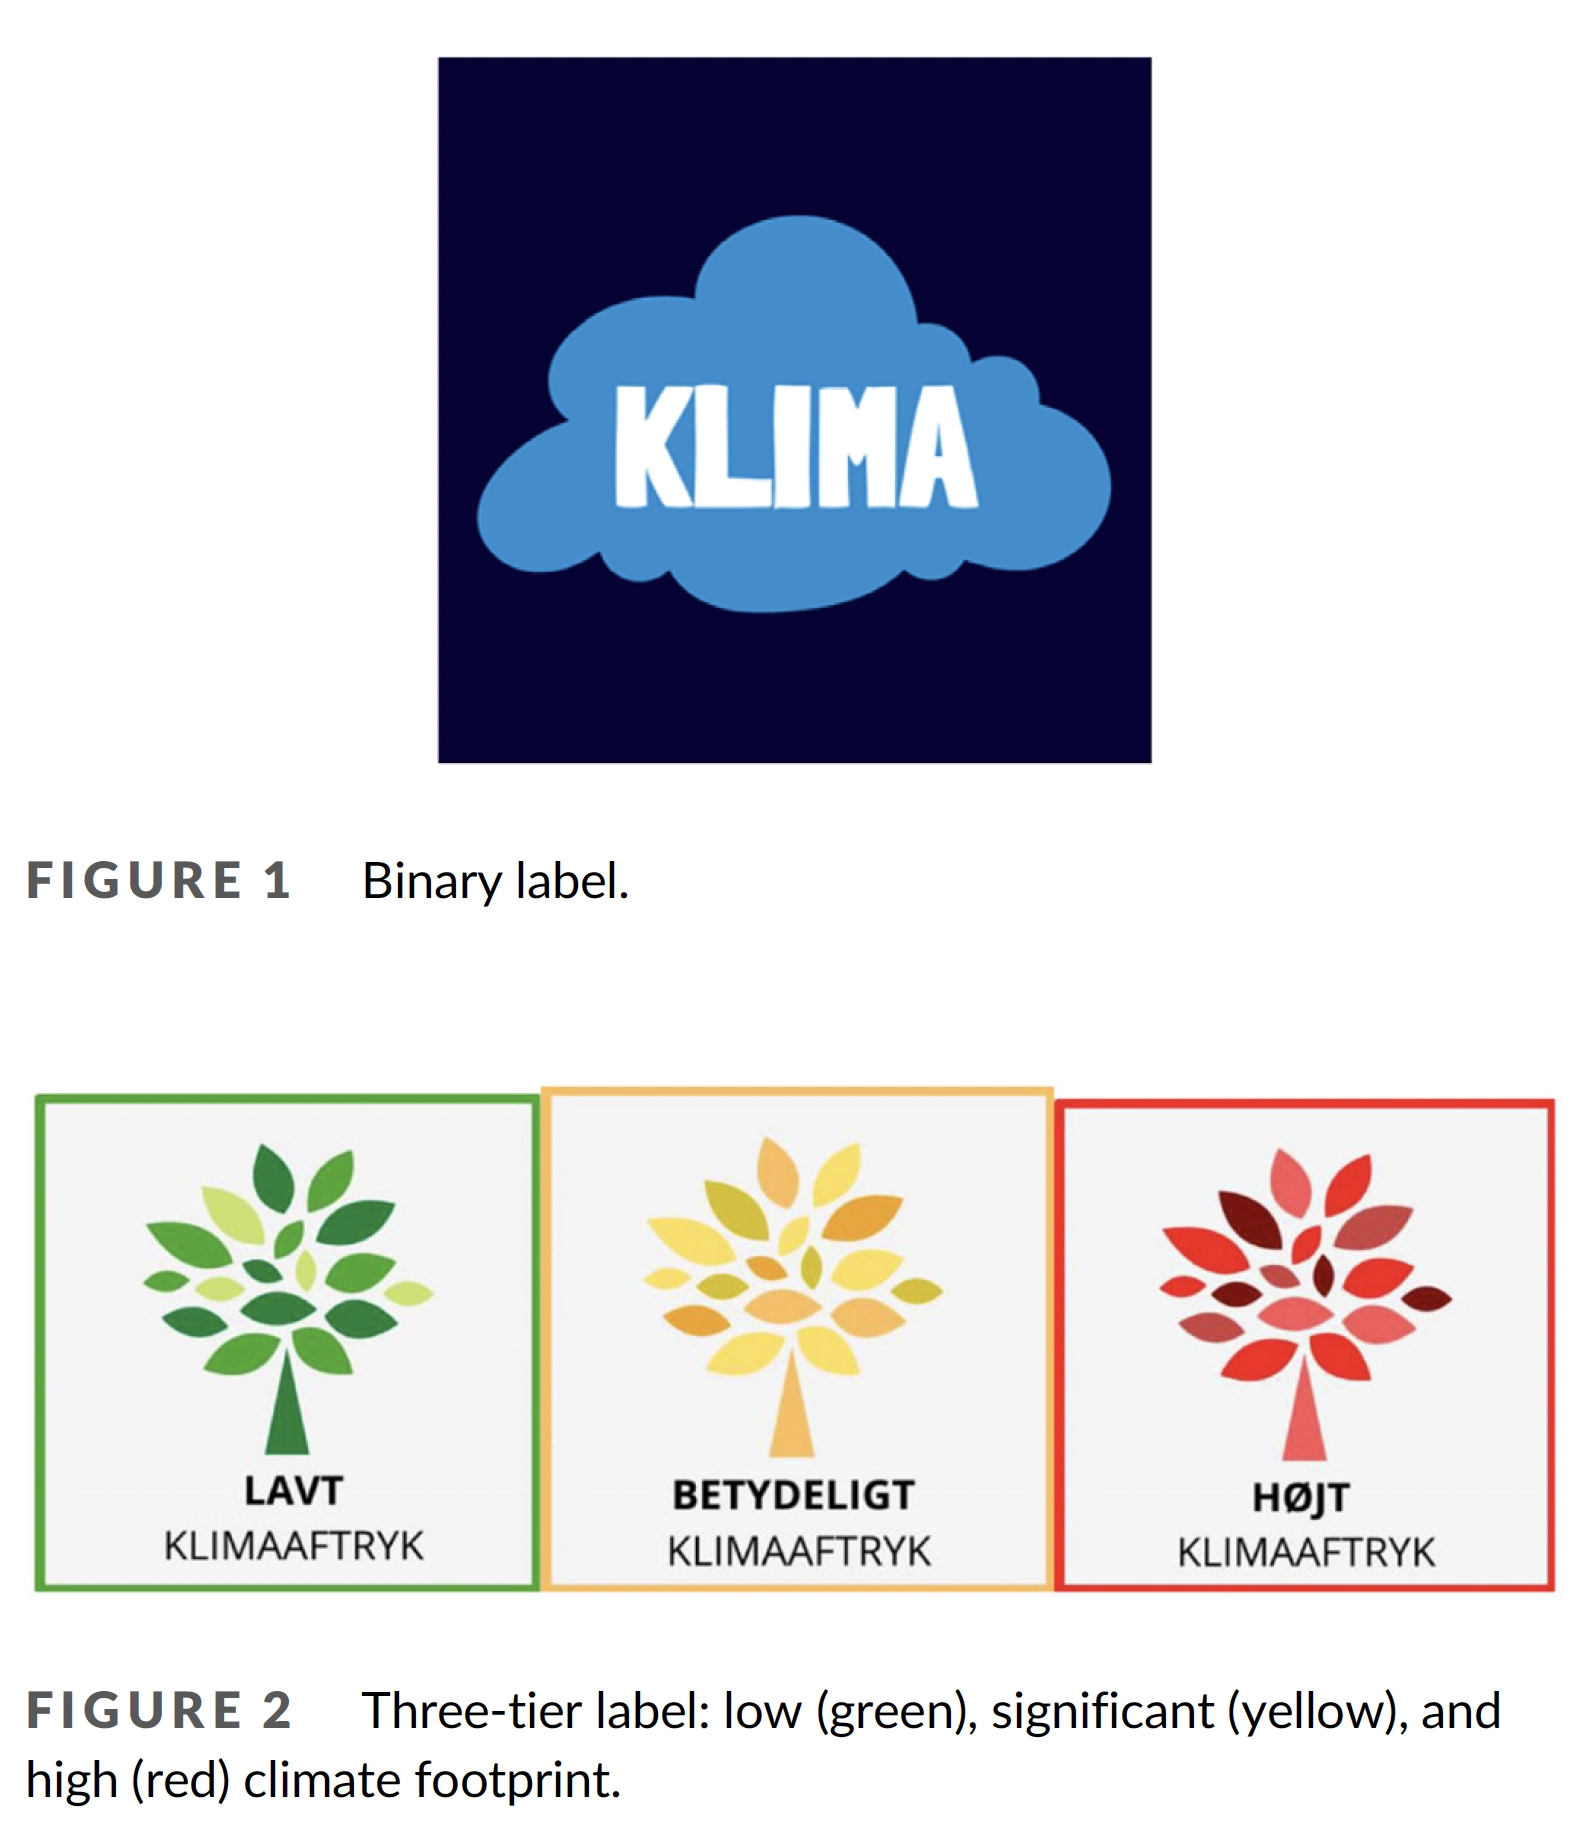
Aim of visuals: Climate labels are a means to reduce greenhouse gas emissions.
People: Denmark, N=109.
Method: online choice experiment. Two self-made climate labels as test material.
Effect of visuals: The three-tier rank-order approach results in more sustainable consumption than the binary approach
Suggestions for design: The results are highly relevant for the design of carbon footprint information on food meals, in particular for online purchases’
Suggestions for policy: -
Comment: The design of both labels is not discussed. They are too different to draw these conclusions.
Edenbrandt AK, Lagerkvist C-J. (2021) ‘Is food labelling effective in reducing climate impact by encouraging the substitution of protein sources?’. Food Policy. 101, 102097. [DOI].
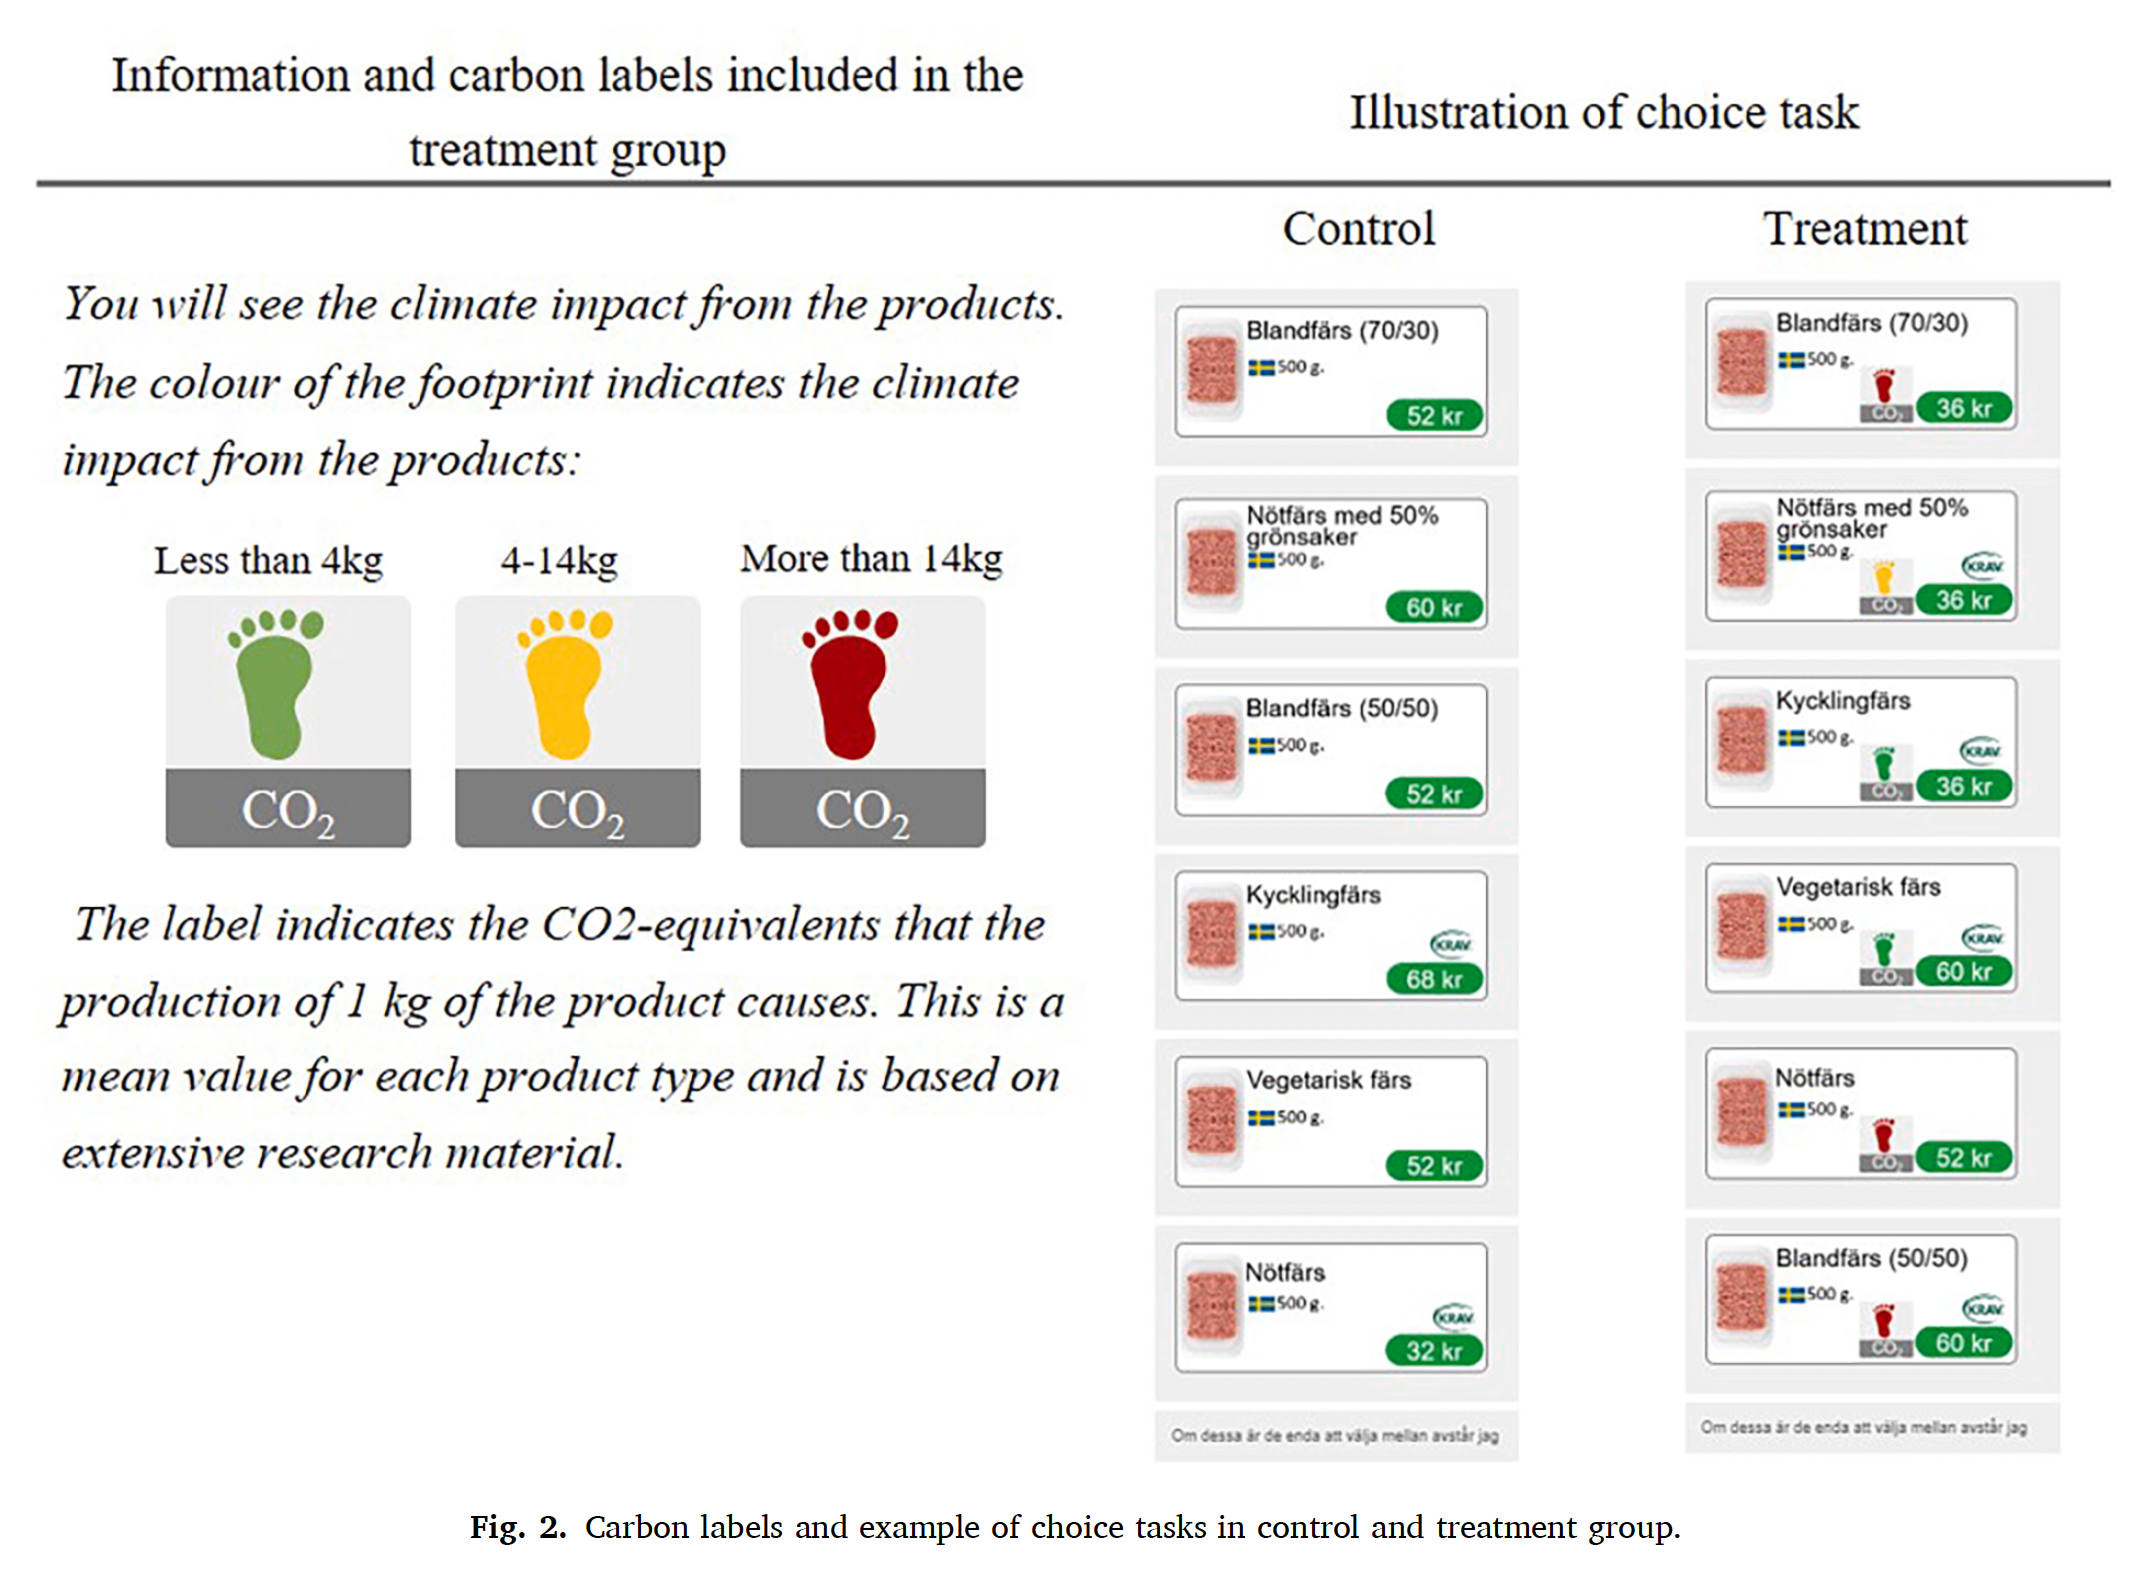
Aim of visuals: A carbon label can assist consumers who wish to identify and make climate-friendly food choices.
People: 1052 responses to online survey, 766 respondents actual purchase, Sweden,.
Method: Online Survey: choice experiment compared with actual purchase data.
Effect of visuals: The traffic light carbon label has an effect on choice behaviour, as it increases the willingness to purchase lower-emissions protein products such as chicken and meat substitutes.
Suggestions for design:
Suggestions for policy: The major policy challenge is how information can be used to attract and engage consumers who have the potential to contribute most to a reduction in meat consumption.
Comment: Only about minced meat, blended with plant based. Main point: A person’s motivation for reducing meat consumption may vary. The willingness to pay for lower emitting protein products is largest among individuals who currently purchase the least amount of meat and the highest amount of sustainable products. However, the 'visual presentation of the choice task was similar to the reatail outlet’s online-shopping tool‘. This is not shown, and it is therefore unknown what participants looked at.
Macdiarmid JI, Cerroni S, Kalentakis D, Reynolds C. (2021) ‘How important is healthiness, carbon footprint and meat content when purchasing a ready meal? Evidence from a non-hypothetical discrete choice experiment’. Journal of Cleaner Production. 282, 124510. [DOI].
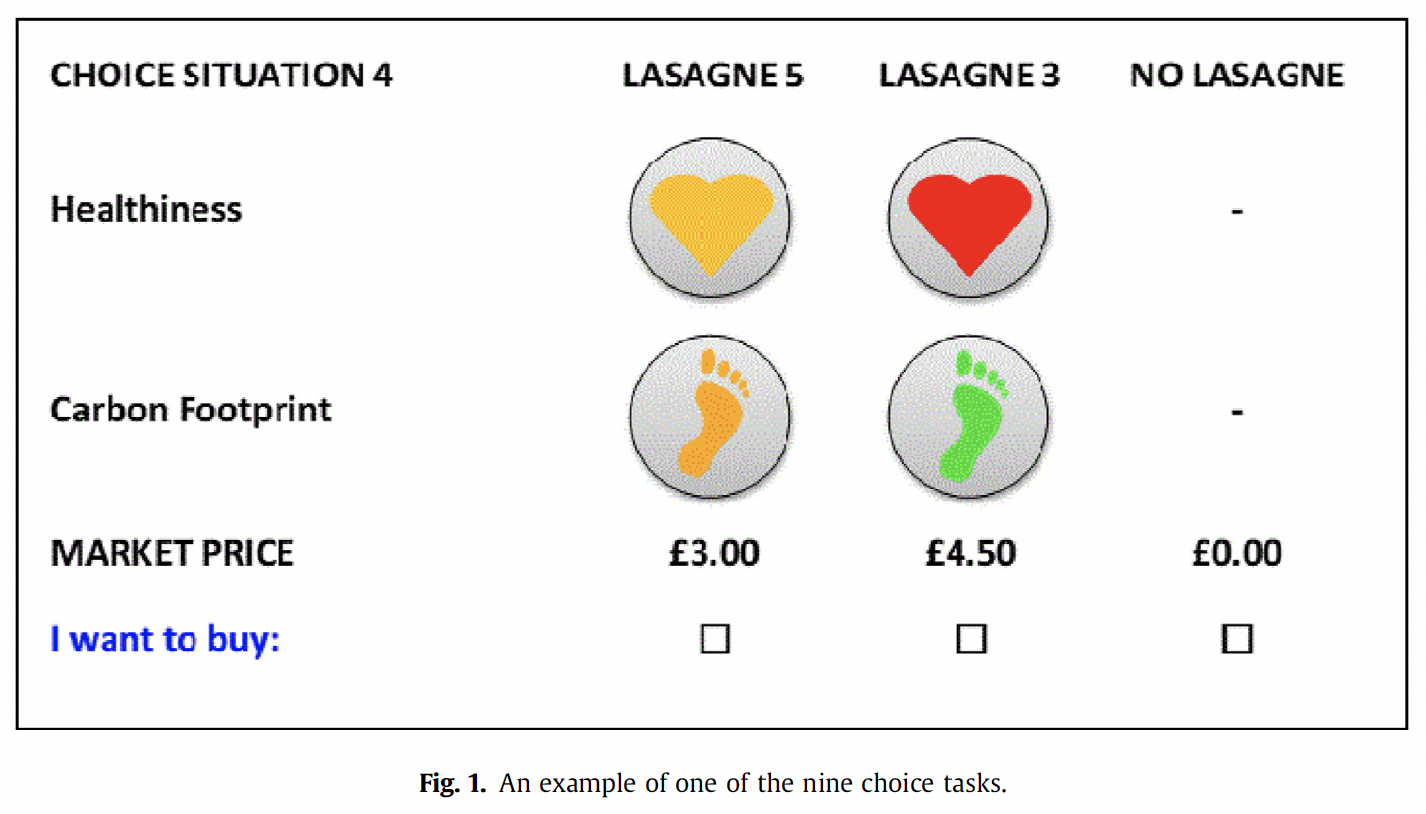
Aim of visuals: Decrease meat consumption. Two Traffic light systems were used, one to indicate the level of carbon footprint (represent as a footprint) and the other the healthiness (represented as a heart).
People: 105 participants, Scotland, individual interviews
Method: Willingness to pay for carbon footprint and healthiness. Comparing 9 different frozen lasagne.
Effect of visuals: Comparing healthiness to carbon footprint, participants were willing to pay significantly more for lasagne labelled amber for healthiness than for those labelled amber for carbon footprint
Suggestions for design: -
Suggestions for policy: Making information about the meat content more explicit than carbon footprint had the unintended consequence of inhibiting purchasing of a more environmentally sustainable meal.
Comment: Visual context is missing: not clear how the symbols appeared on the front of the packaging.
Feucht Y, Zander K. (2018) ‘Consumers' preferences for carbon labels and the underlying reasoning. A mixed methods approach in 6 European countries’. Journal of Cleaner Production. 178, 740e748. [DOI].
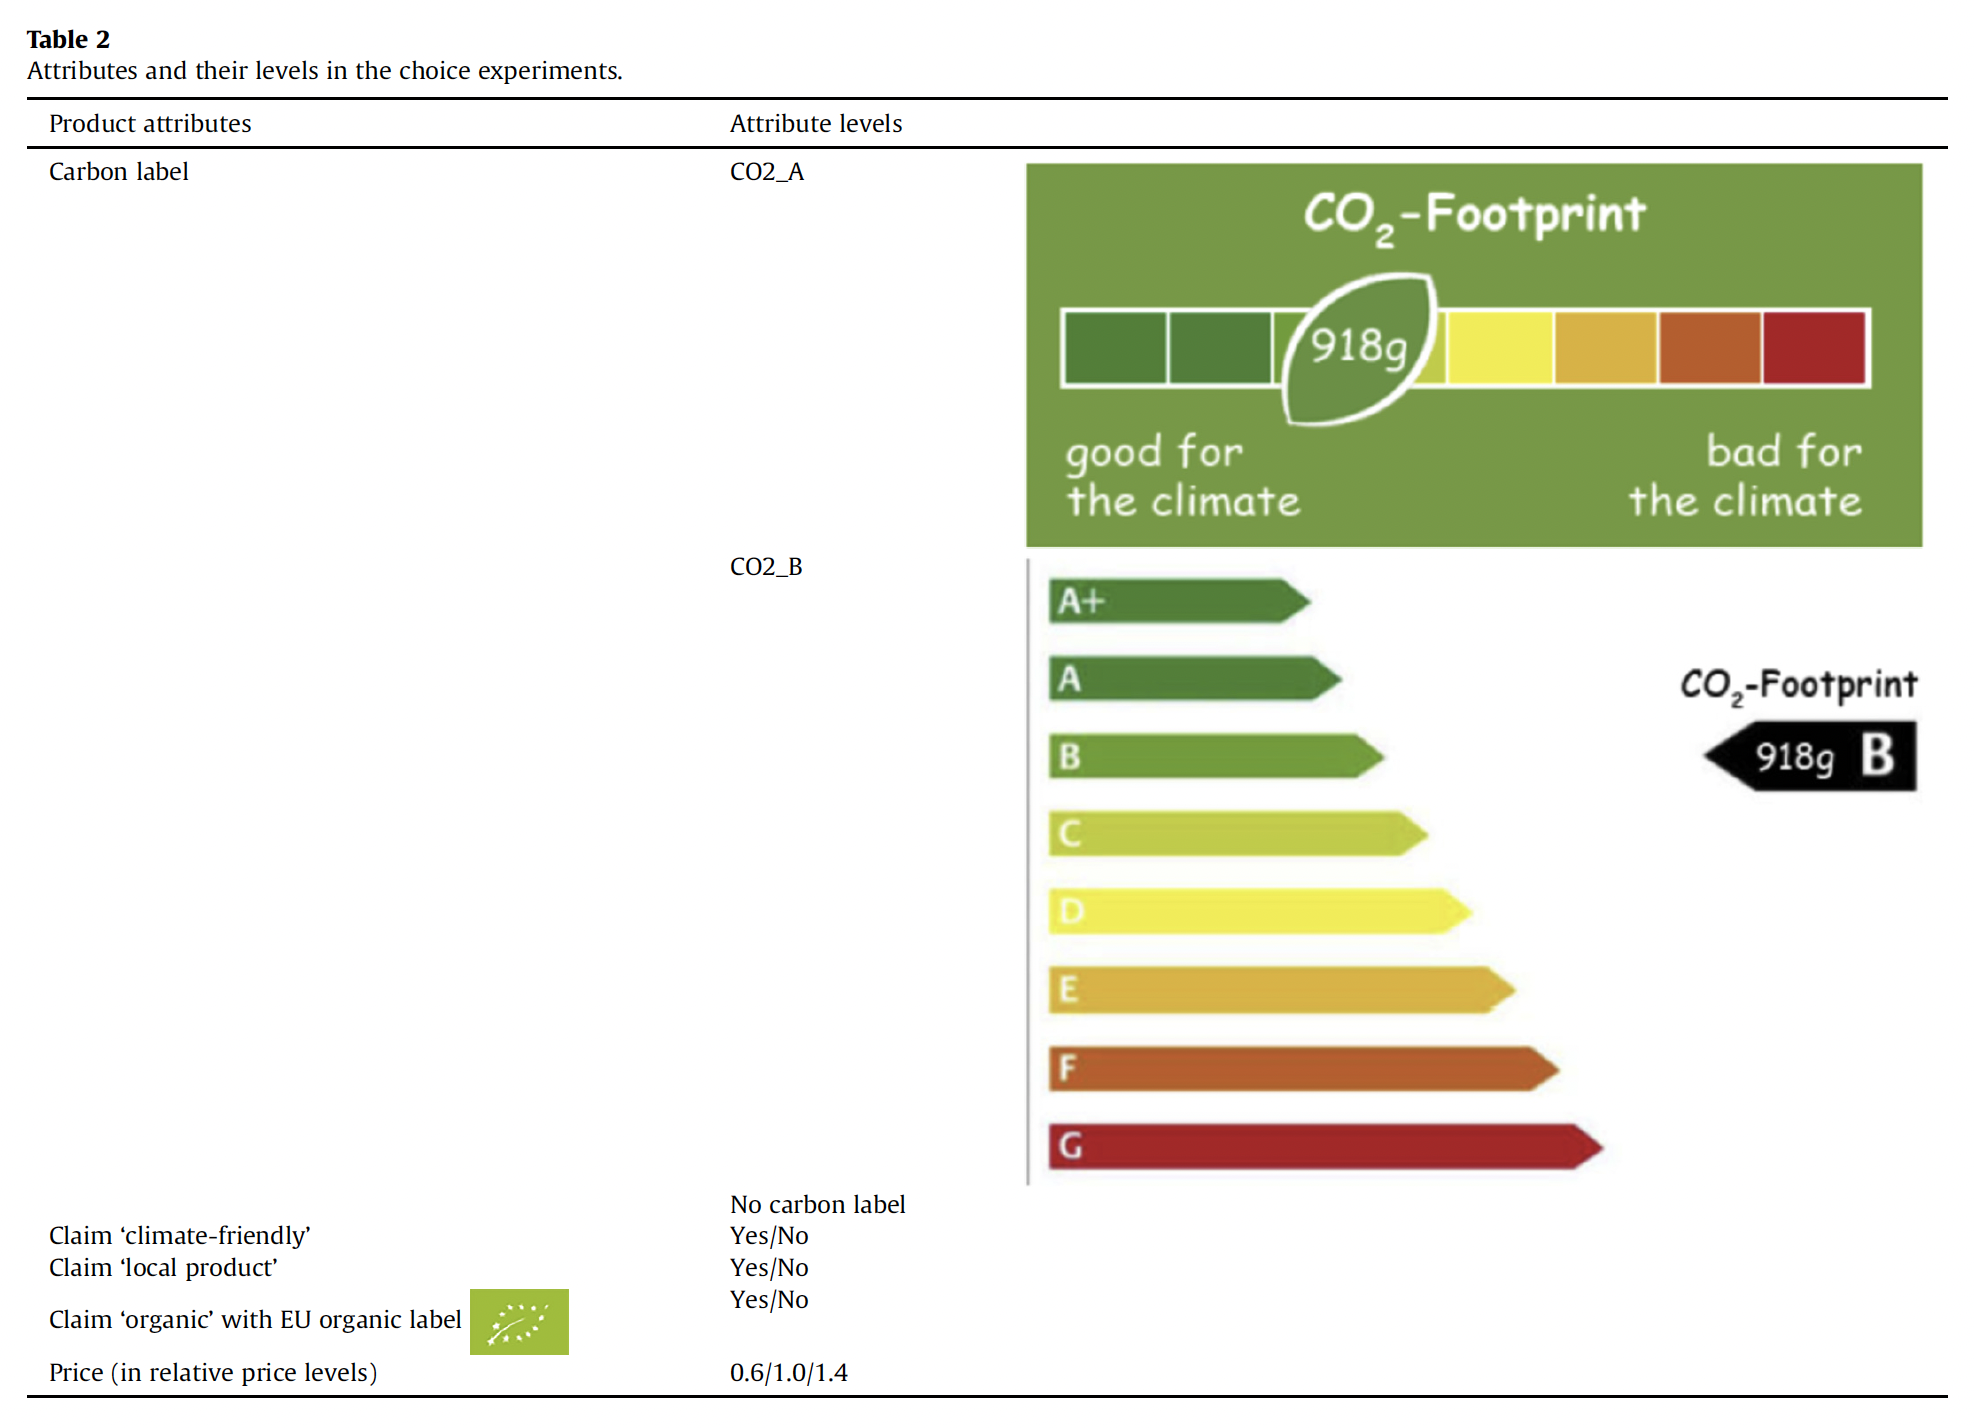
Aim of visuals: Whether carbon labels are an appropriate and effective tool for increasing climate-friendly food consumption in Europe.
People: Six European countries. 6007 online + 32 interviews (France 10, Germany 11, UK 11).
Method: Questionnaire and qualitative face-to-face interviews
Effect of visuals: The presence of a carbon label increases the purchase probability and that consumers
are willing to pay a price premium of up to 20% for a carbon label. Due to their lack of knowledge and problem awareness, consumers might be overburdened with respect to climate-friendly buying decisions.
Suggestions for design: A combination of a horizontal scale in traffic light like colors with an absolute number of CO2-equivalents is preferred. (= CO2-A in table 2).
Suggestions for policy: Consumers expect policy makers and retailers to set up appropriate structures
to support climate-friendly consumption.
Comment: Study was about milk only. Results are generalised to all food products. The design of the scale in CO2-A seems odd: left to right? + colour coding of A and A+ is identical? The use of comic sans as a typeface might not be suitable.
Gadema Z, Oglethorpe D. (2011) ‘The use and usefulness of carbon labelling food: A policy perspective from a survey of UK supermarket shoppers’. Food Policy. 36(6), 815-822. [DOI].
428 UK supermarket shoppers (online questionnaire): confusion in interpreting and understanding labels is correspondingly high at a total of 89%, primarily as a result of poor communication and market proliferation. The cluster analysis in 3 groups (mid-life sustainability seekers, young calorie and carbon conscious, mature local agnostics) is interesting.
Potter C, Bastounis A, Hartmann-Boyce J, Stewart C, Frie K, Tudor K, Bianchi F, Cartwright E, Cook B, Rayner M, Jebb SA. (2021) ‘The Effects of Environmental Sustainability Labels on Selection, Purchase, and Consumption of Food and Drink Products: A Systematic Review’. Environment and Behavior. 53(8), 891–925. [DOI].
A systematic review 56 studies about environmental labels on food. No illustrations: not clear if these ecolabels can be directly compared. Differentiation between ‘text only’ (36), ‘logo’ (13), and ‘combination’ (27).